
Smart Dates
Whether you are a model owner or a reviewer, you need to be able to separate periods.

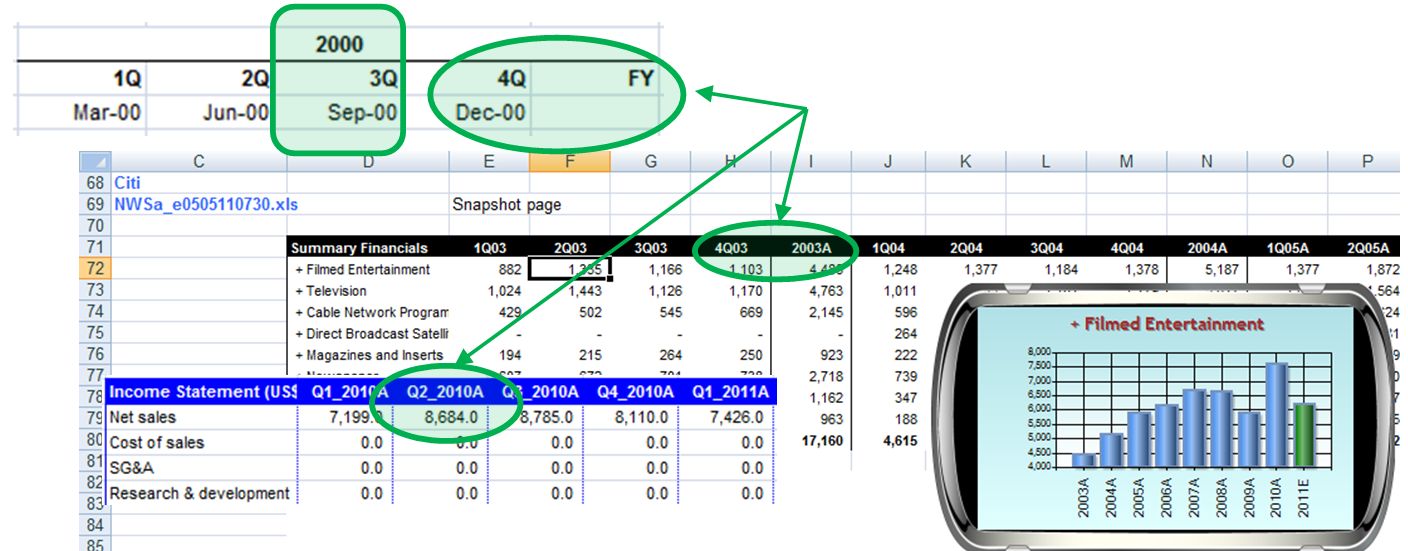
RitchViewer Smart Dates has been designed to search the headers and separate this data visually in real-time.
Many models utilize groups where they can collapse non-annual data, and/or carry "Summary" sheets linked back to a source sheet to cater for seeing just annual data.
As you are aware, "Summary" sheets are fraught with danger of poor links or updates being made on the "Summary" sheet and not on the underlying data. Groups can be cumbersome in opening and closing without loosing your place in the model.
RitchViewer Smart Dates instantly determines whether a model has both annual and non-annual data and automatically offers you just the annual data where you can analyse year-on-year trends. If you swipe your mouse down, then you can view just the non-annual data and look for seasonality across these periods. A further swipe down reveals both together - as you would get if this was just a Microsoft Excel, Google Sheets, Apple Numbers, or other 3rd party charts. You can see in the video below, for this example of Revenue, that there is little information in a chart that shows both quarterly and annualised revenue. Simple and quick separation of the periods leads to greater insights into the model.

Fast Fact
For the technically minded, we have created a mechanism that does 'Advanced Header and Label Analysis'. Going through a number of different models revealed the need for Multi-Column Labels.

Similarly, a large number of financial models were processed to create a Full Year versus Partial Year algorithm that yields RitchViewer Smart Dates.